Telco Customer Churn
Executive Summary
Introduction
The telecommunications industry faces rapid evolution and intense competition, with customer churn being a critical metric affecting revenue and growth. This report outlines an analytical approach to understanding and predicting customer churn, aiming to support strategic decision-making in customer retention efforts.
Objective
To leverage predictive analytics for identifying factors contributing to customer churn in the telecommunications sector, enabling the development of targeted strategies to enhance customer retention.
Key Insights and Recommendations
1. Enhance Fiber Optic Internet Service
- Insight: Fiber optic internet emerges as a significant churn driver, indicating underlying issues with this service.
- Action: Conduct a comprehensive service quality review and customer satisfaction analysis specifically for fiber optic internet users to identify improvement areas.
2. Optimize Digital Payment Experience
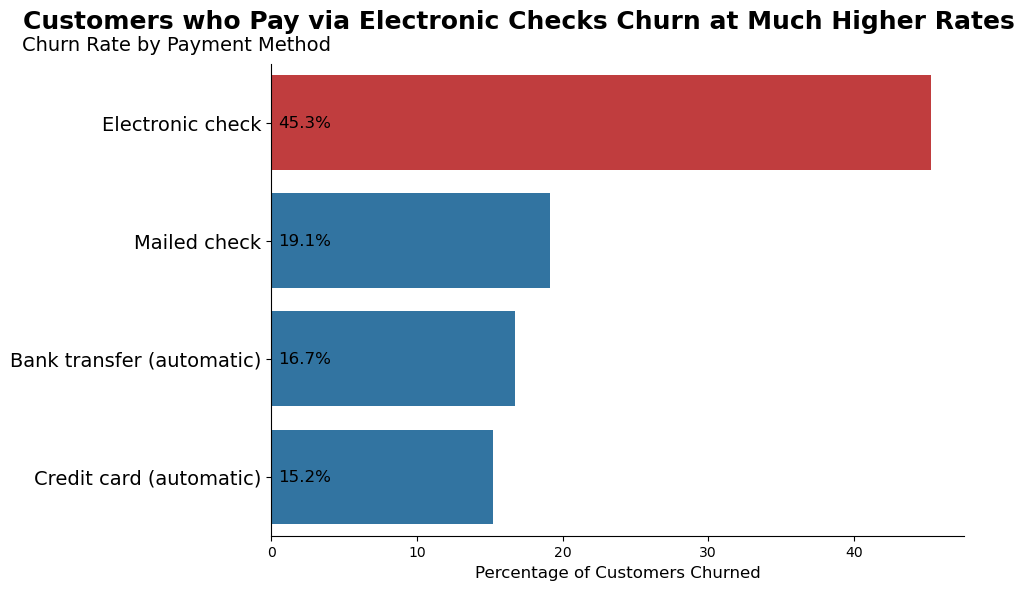
- Insight: A notably high churn rate among customers using electronic checks points to potential friction in the digital payment process.
- Action: Revise the electronic check payment process to enhance usability and introduce incentives for adopting alternate, more efficient payment methods.
3. Improve Contractual Flexibility
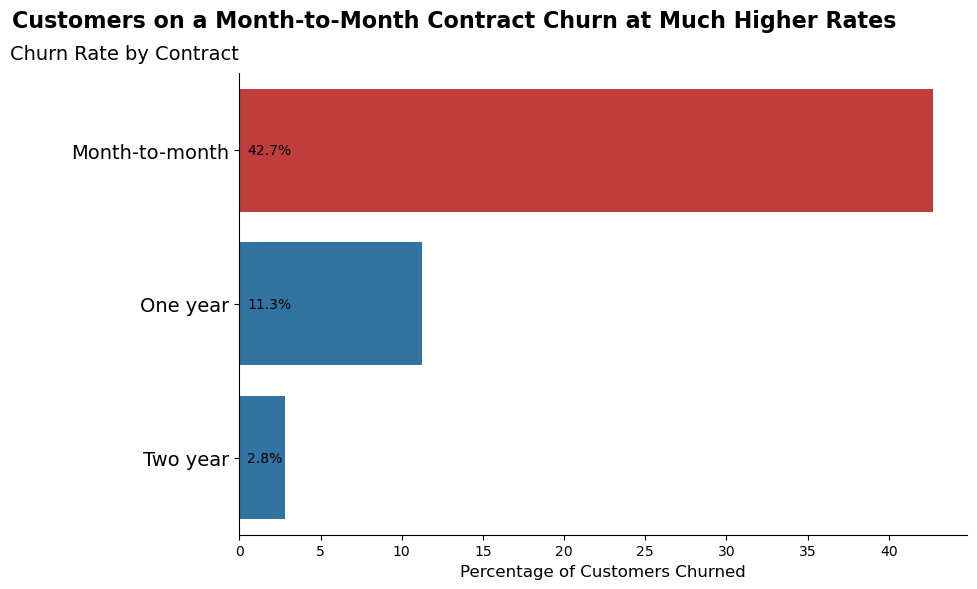
- Insight: month-to-month contracts result in higher churn rates suggesting a mismatch between customer expectations and contract offerings.
- Action: Explore the introduction of flexible contract terms and incentives for longer-term commitments to align with customer preferences and reduce churn.
4. Deploy Targeted Customer Feedback Mechanisms
- Insight: Specific churn drivers within key customer segments remain inadequately understood.
- Action: Implement targeted surveys and feedback loops focused on high-churn customer segments to glean actionable insights, thus enabling more personalized and effective retention strategies.
5. Initiate Early Customer Retention Efforts
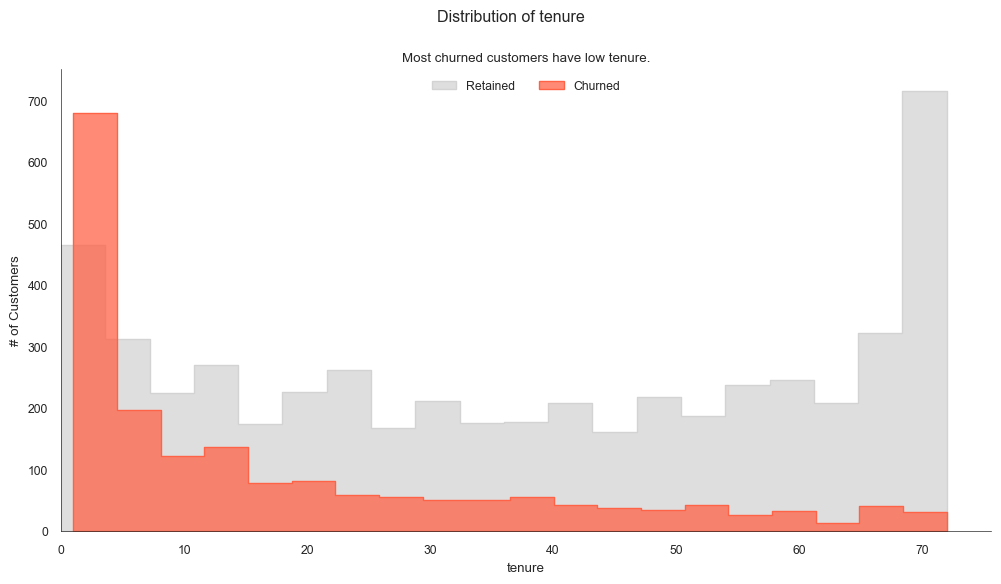
- Insight: The initial stages of the customer lifecycle (first month/payment) are critical churn points.
- Action: Develop and deploy early engagement and retention programs aimed at new customers, focusing on the critical first month to enhance satisfaction and loyalty.
Analysis Overview
Data Insights
My analysis uncovered key factors linked to churn, such as service type, payment methods, contract length, and customer demographics. I found that subscribers to fiber optic internet services and those using electronic checks for payments exhibited notably higher churn rates.
Predictive Modeling
In my exploration of various models, I discovered that the Random Forest model, especially when adjusted with undersampling to tackle class imbalances, offered the most balanced performance in predictive accuracy. This model proved particularly effective in pinpointing potential churners, a crucial step for implementing timely retention strategies.
Conclusion and Path Forward
Summary of Findings
My research highlights the critical impact of service quality (particularly fiber optic internet), the payment experience, and contract flexibility on customer churn. Through effective predictive modeling, I've identified pivotal areas requiring targeted intervention to mitigate churn.
Future Directions
- Enhanced Data Collection: I propose broadening the data collection scope to unveil further insights, thereby enhancing the predictive accuracy of churn models.
- Advanced Analytical Techniques: I suggest delving into more sophisticated models and machine learning techniques, which could lead to incremental improvements in predicting churn and understanding underlying patterns.
- Strategic Implementation: It's imperative to translate these insights into actionable strategies and programs, aiming to reduce churn and bolster customer loyalty effectively.
Appendix: Technical Overview
For those keen on the detailed methodology—including data preparation, exploratory analysis, model selection, and evaluation—the full Jupyter Notebook is available upon request. This document offers an in-depth look at the technical groundwork of my findings.
Data Collection and Preparation
Dataset Description
Each row in the dataset corresponds to an individual customer, with columns detailing various attributes. The dataset encapsulates a diverse range of information, structured into several key categories:
- Churn: Central to the dataset is the 'Churn' column, which identifies customers who have discontinued their services within the last month. This binary attribute is crucial for understanding customer retention and turnover.
- Services Subscribed: The dataset details the array of services each customer has subscribed to. This includes basic phone services, multiple lines options, internet services, and a variety of digital offerings like online security, online backup, device protection, technical support, and options for streaming TV and movies.
- Account Information: It provides insights into the customer's account history and preferences. This includes the tenure of the customer (how long they've been with the company), the type of contract they are on, their chosen payment method, whether they use paperless billing, and financial aspects such as monthly charges and total charges accrued.
- Demographic Information: The dataset also covers demographic aspects of the customers, including their gender, age range, and family status, such as whether they have partners or dependents.
Exploratory Data Analysis (EDA)
Univariate Analysis
- Services Subscribed
Internet Service
Customers with Fiber Optic are much more likely to Churn than those with DSL.
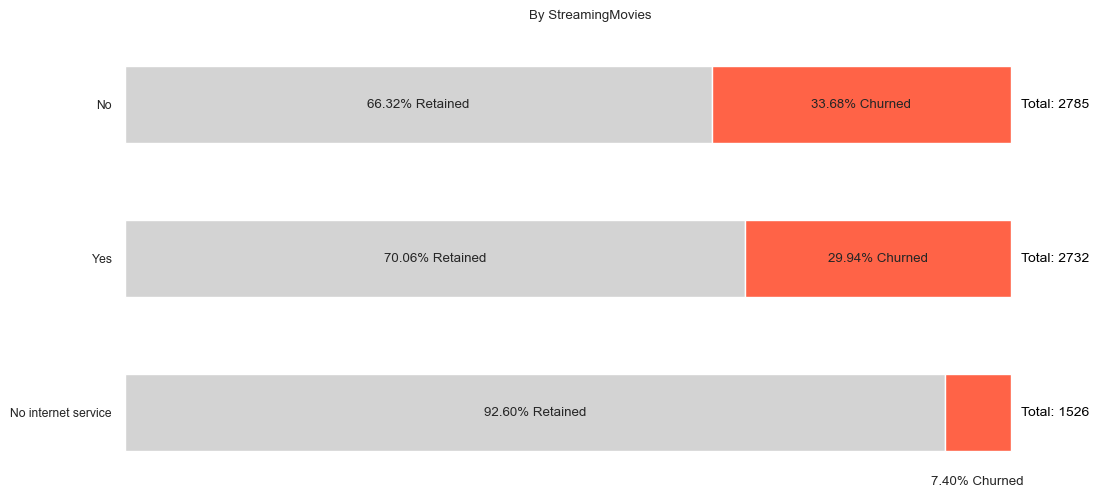
As Part of Internet Service, many additional offerings are found such as Streaming TV, Streaming Movies, Device Protection, and more. it seems that if customers had a package that offered Streaming Movies or TV, this had little effect on if they churned.
Streaming Movies
Among those who bought an internet package, the churn rate is relatively similar.
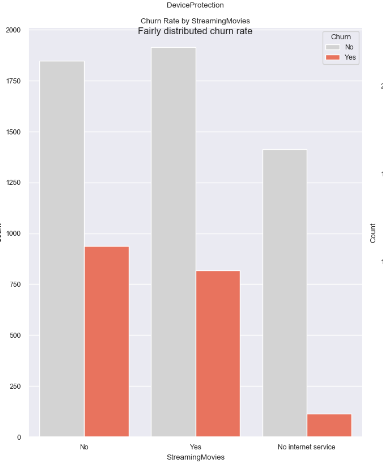
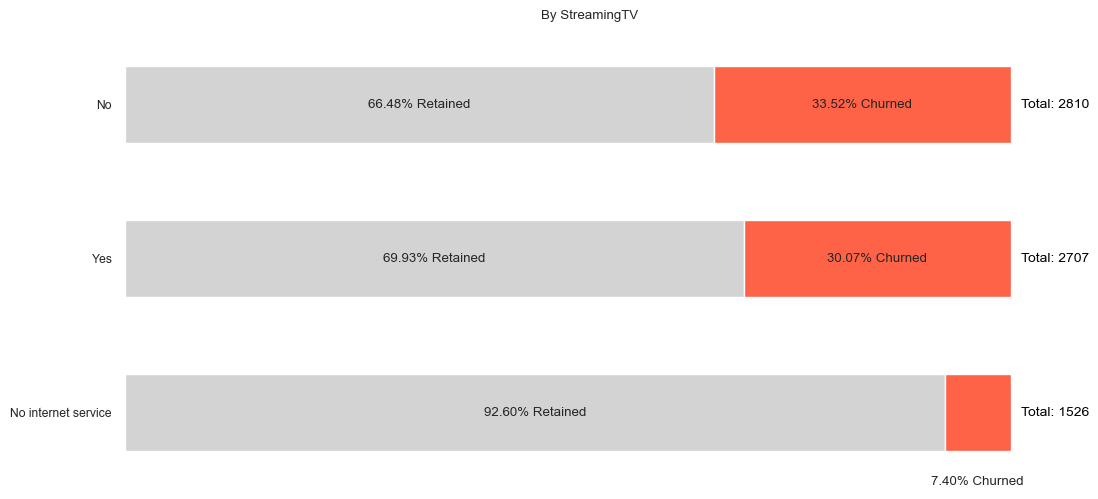
Streaming TV
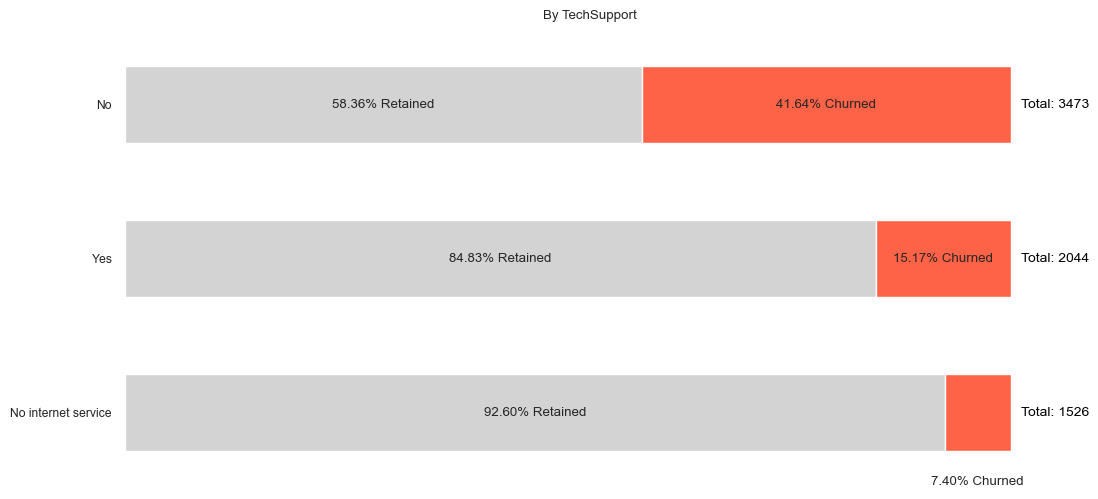
While among other offerings such as Device Protection, Tech Support, Online Backup, and Online Security, it is found that those who did not have these features the churn rates are much higher.
Tech Support
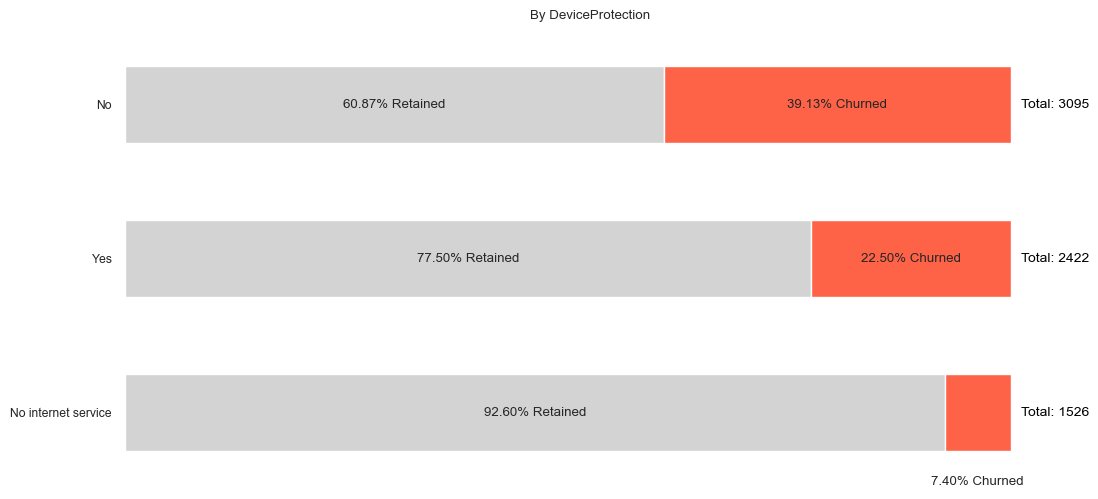
Device Protection
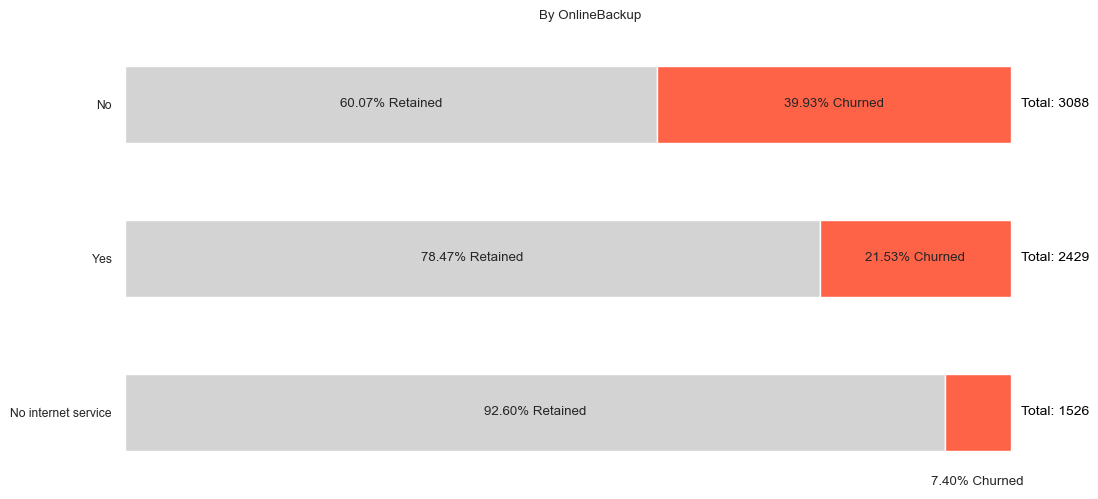
Online Back-Up
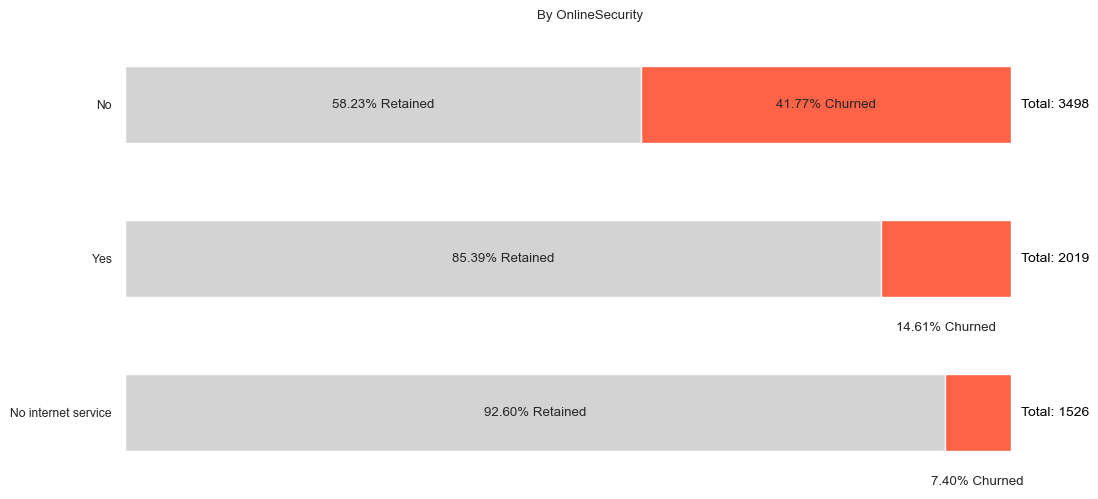
Online Security
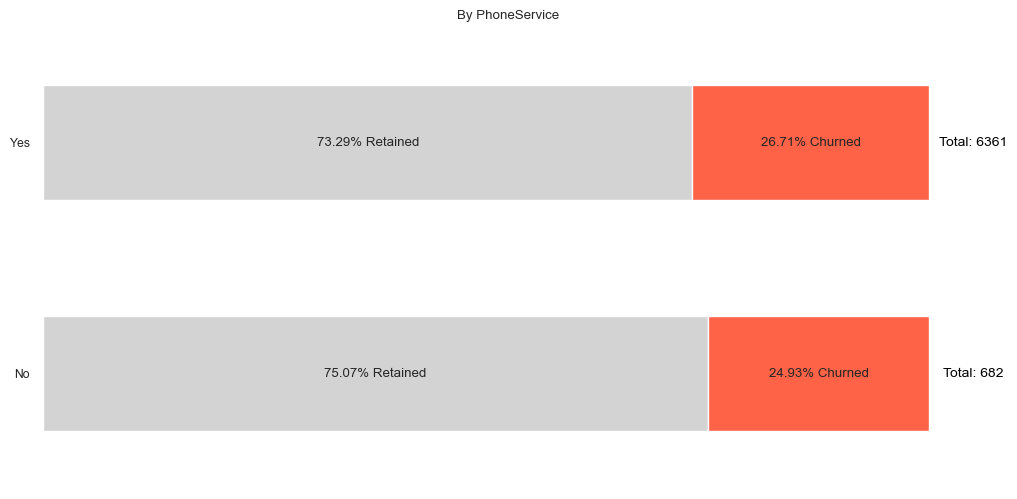
Phone Service
- Whether a Customer Has phone service, as well as if they have multiple lines has little to no effect on churn rate
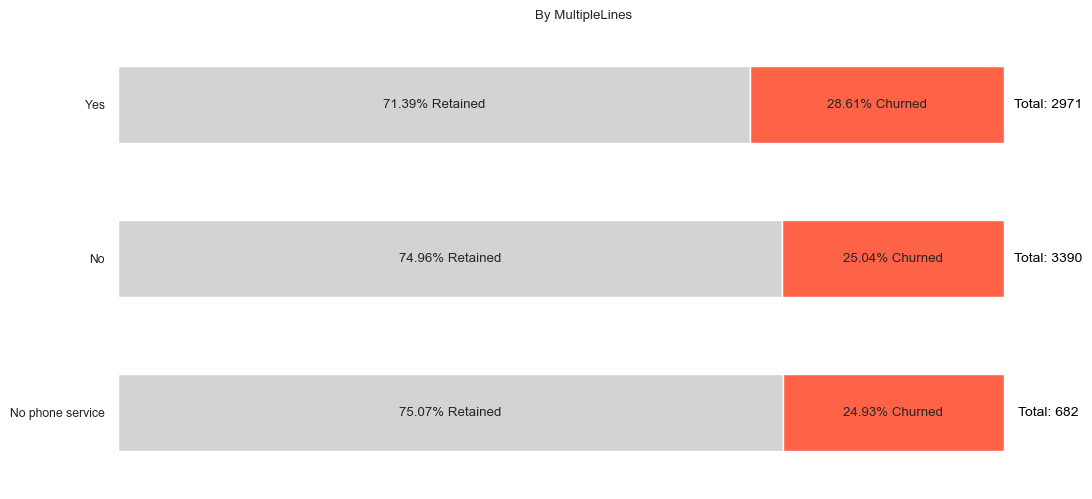
- Whether a Customer Has phone service, as well as if they have multiple lines has little to no effect on churn rate
- Demographic
- Gender (has no effect on churn rate)
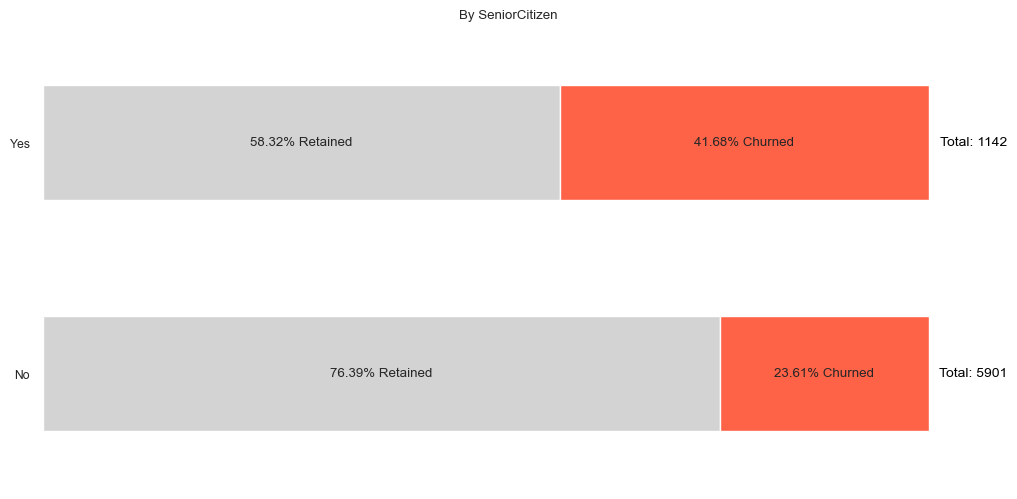
Senior Citizen
Senior Citizens have a higher chance of Churning.
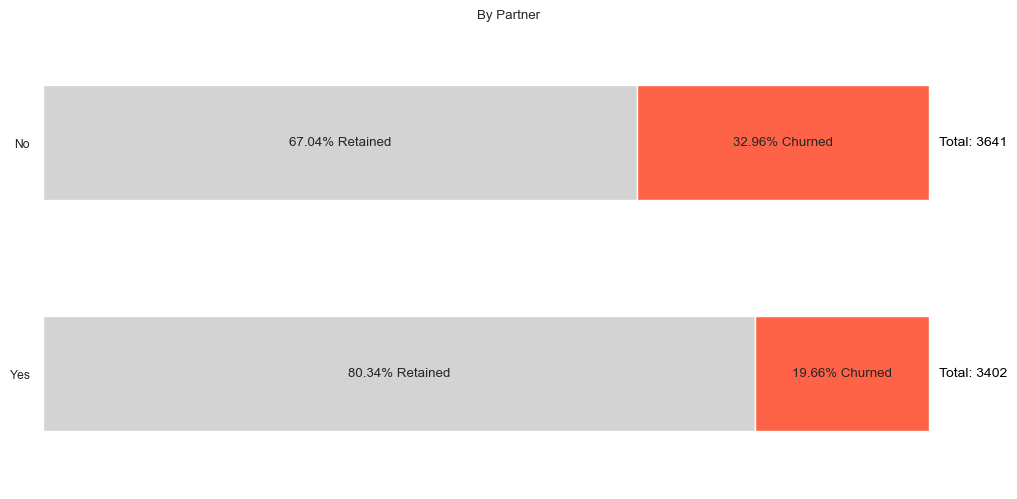
Partner
People without partners are more likely to churn.
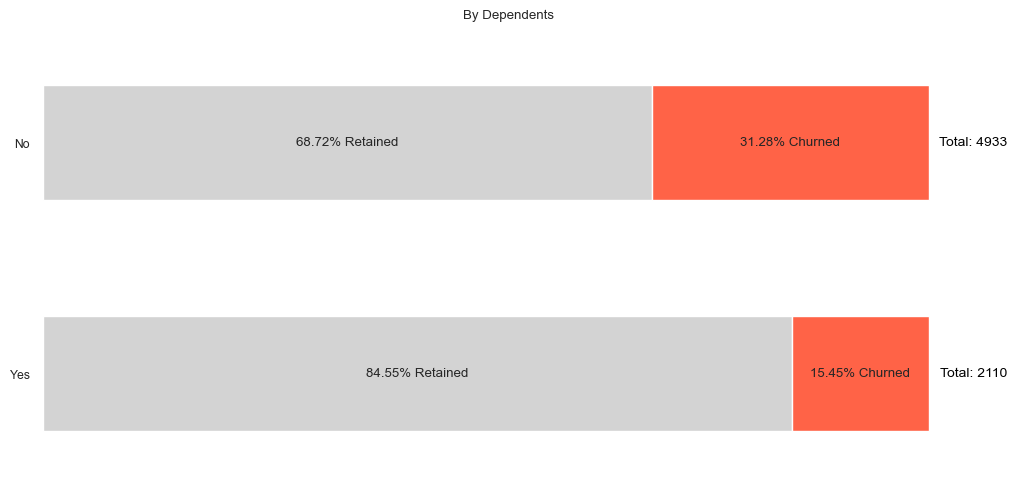
Dependents
Those without Dependents are more likely to Churn.
- Account Information
Tenure
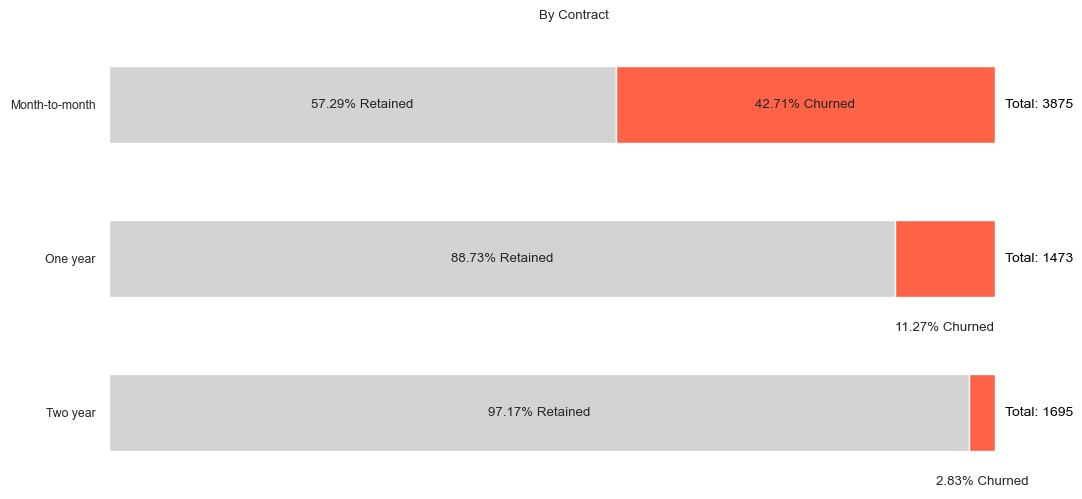
Contract
The longer the contract, the less likely it is for a customer to churn.
Paperless Billing
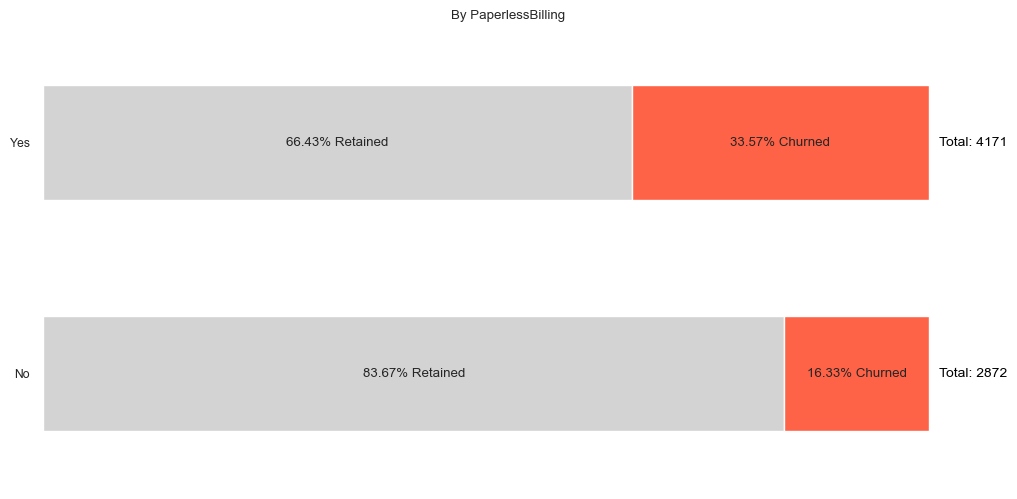
Those who adopt paperless billing are much more likely to churn.
Payment Method
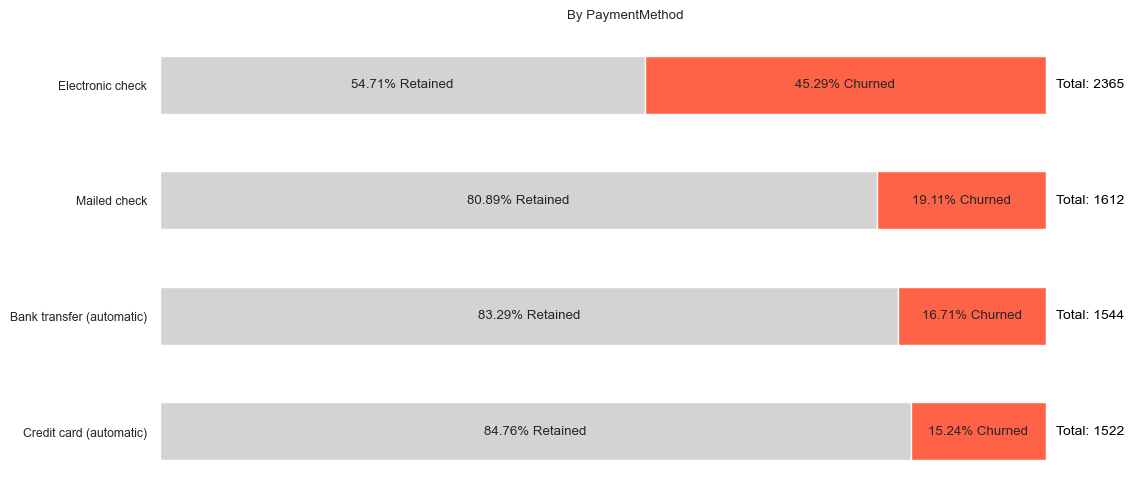
- Customers Who use Electronic Checks are at a much greater risk of churning.
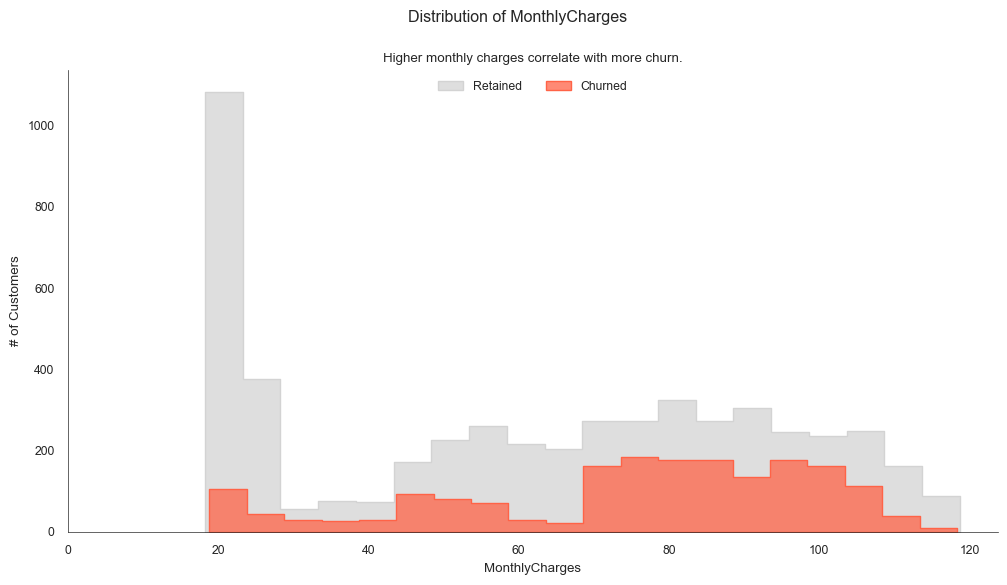
- Customers Who use Electronic Checks are at a much greater risk of churning.
Monthly Charges
Total Charges
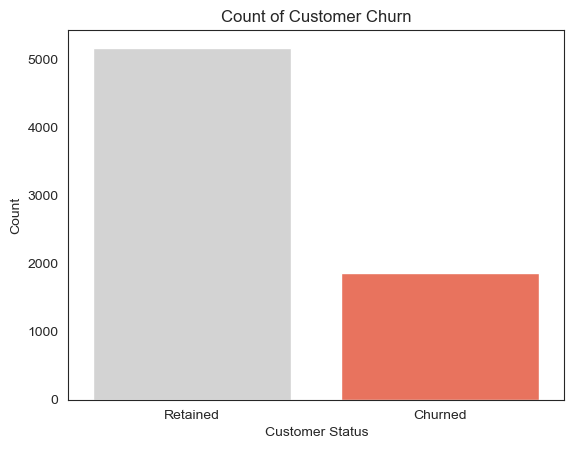
Churn [The Target Variable]
Multivariate Analysis
Now we’ll look at the relationships between various features.
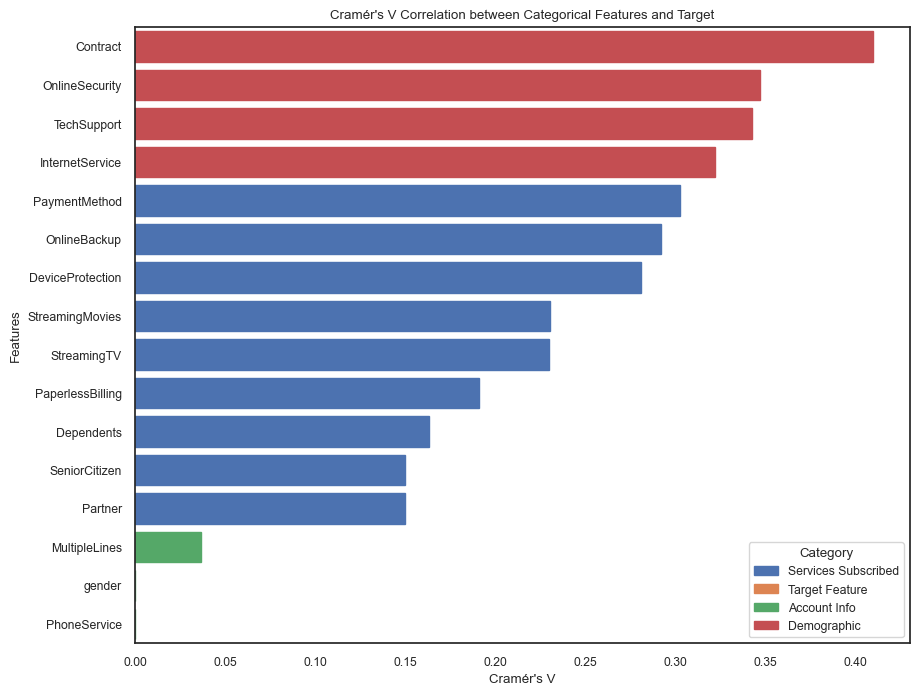
Categorical Features Correlation With Churn Rate
To calculate the association between categorical features and a binary target variable (such as Churn), you can use statistical measures like Cramér's V. This measure is based on a chi-squared statistic and is particularly useful for understanding the strength of the relationship between categorical features and a binary target such as Churn.
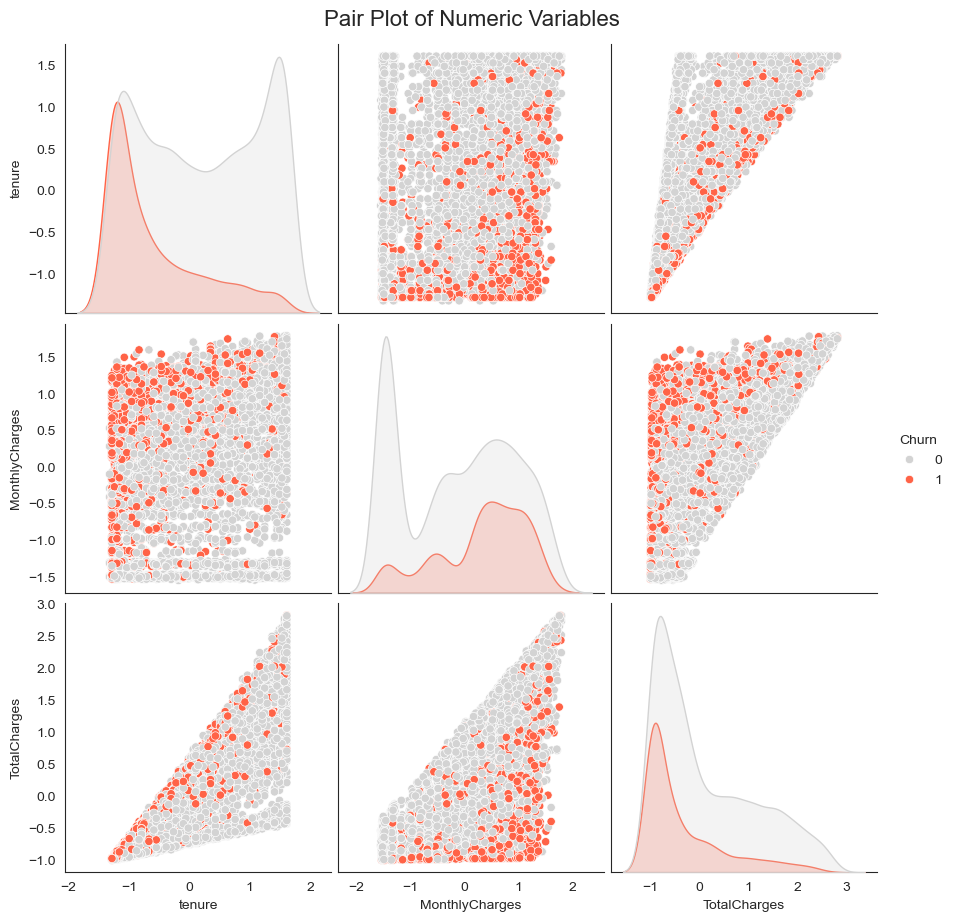
Additional Data Transformations
Standard Scaling
- When you're working with a dataset that includes both one-hot encoded categorical features and numerical features, using a StandardScaler can be a bit nuanced.
- If your dataset contains both types of features and you decide to use StandardScaler, you should apply it only to the numerical features.
- You can achieve this by scaling the numerical features separately and then combining them back with the one-hot encoded features before training your model. Here's a basic approach to doing this with Python and pandas:
from sklearn.preprocessing import StandardScaler

	# Splitting the dataset into numerical and categorical features
	numerical_features = customer_df.select_dtypes(include=['int64', 'float64'])
	categorical_features = customer_df.select_dtypes(include=['object', 'category'])

	# Applying StandardScaler to the numerical features
	scaler = StandardScaler()
	scaled_numerical = scaler.fit_transform(numerical_features)
	scaled_numerical_df = pd.DataFrame(scaled_numerical, columns=numerical_features.columns)

	# Combining scaled numerical features and categorical features
	customer_df = pd.concat([scaled_numerical_df, categorical_features], axis=1)
One-Hot Encoding…
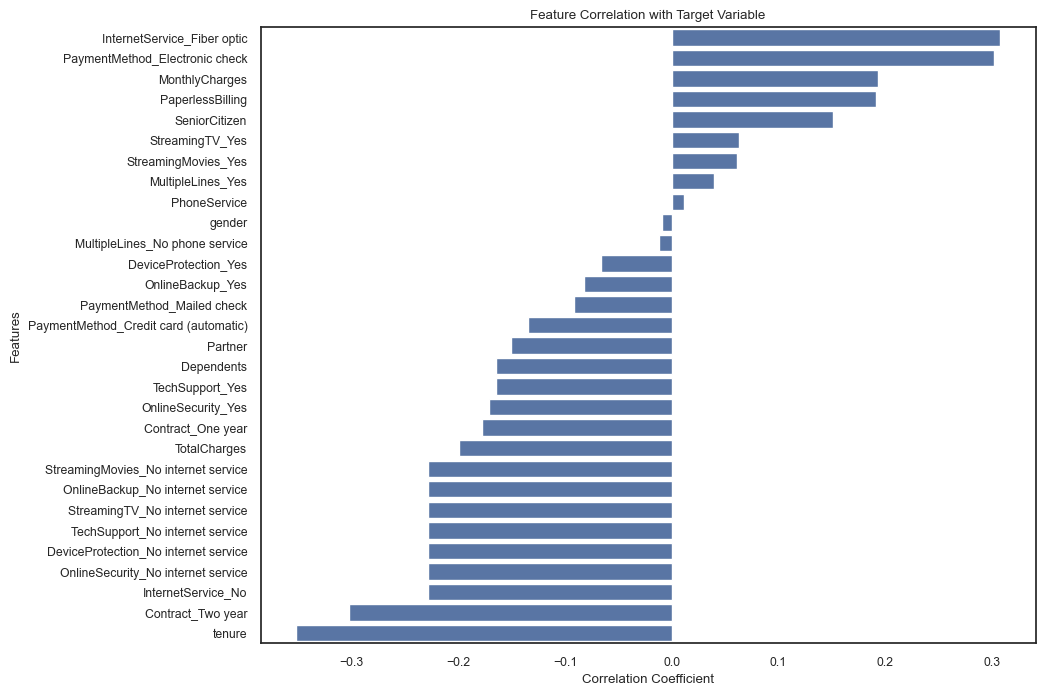
Categorical Features Correlation With Churn Rate (after One-Hot Encoding)
- Each categorical feature is transformed into a new binary column, where the presence of the category is marked by 1 and absence by 0. After this step is done, we can do more granular analysis.
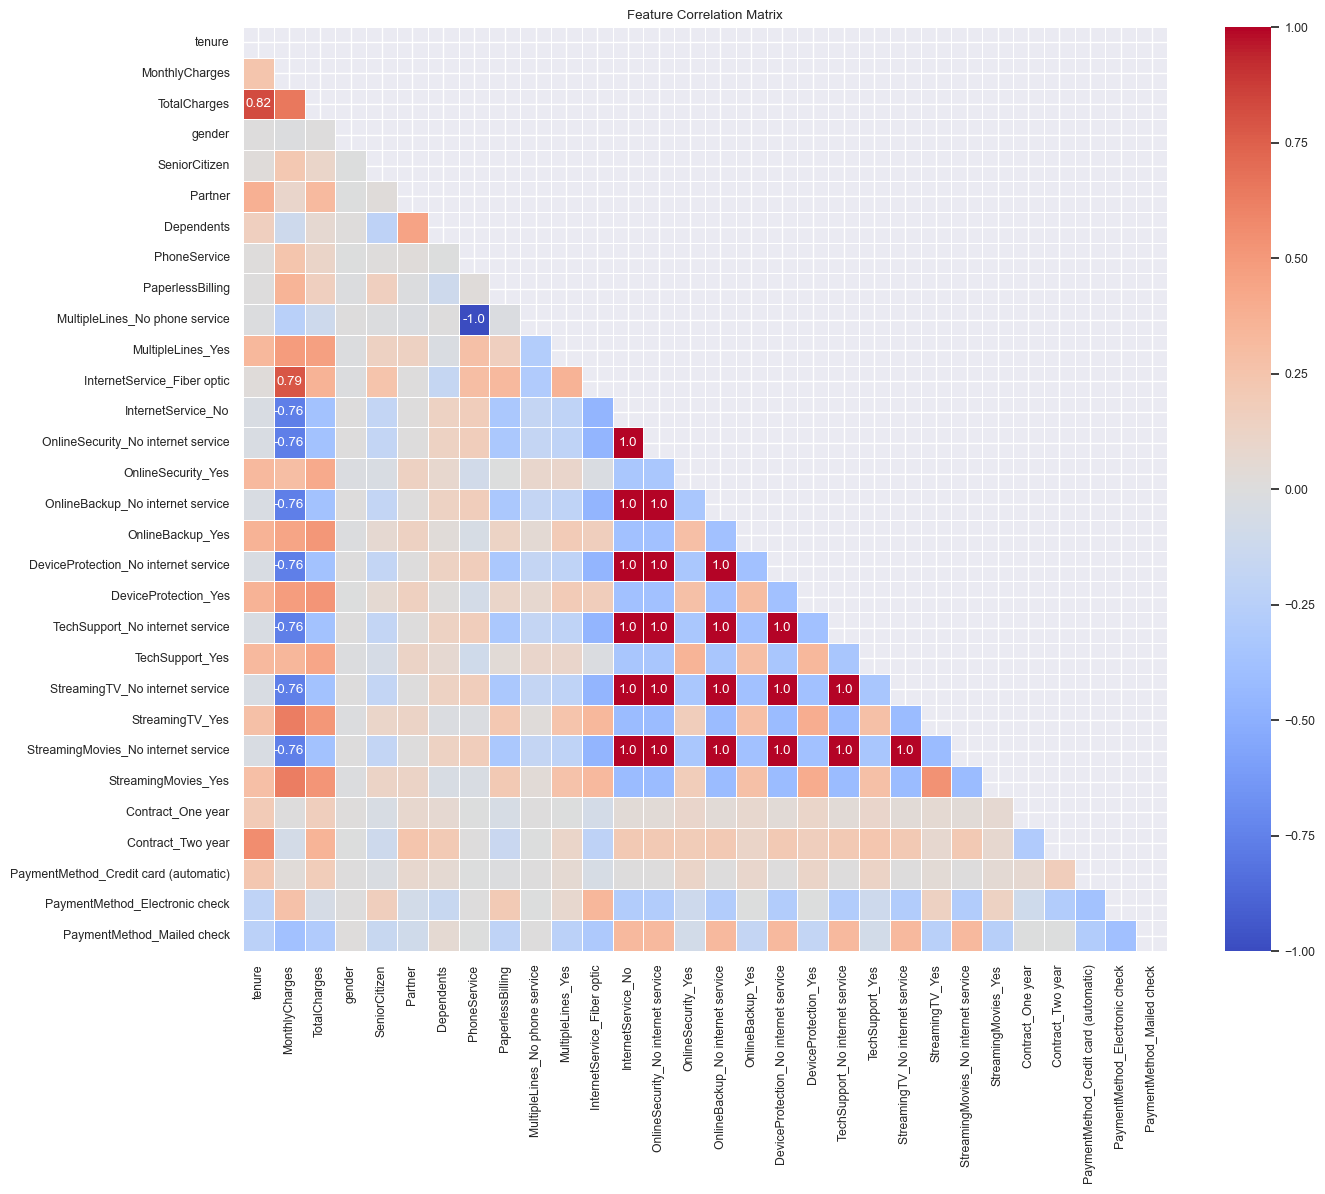
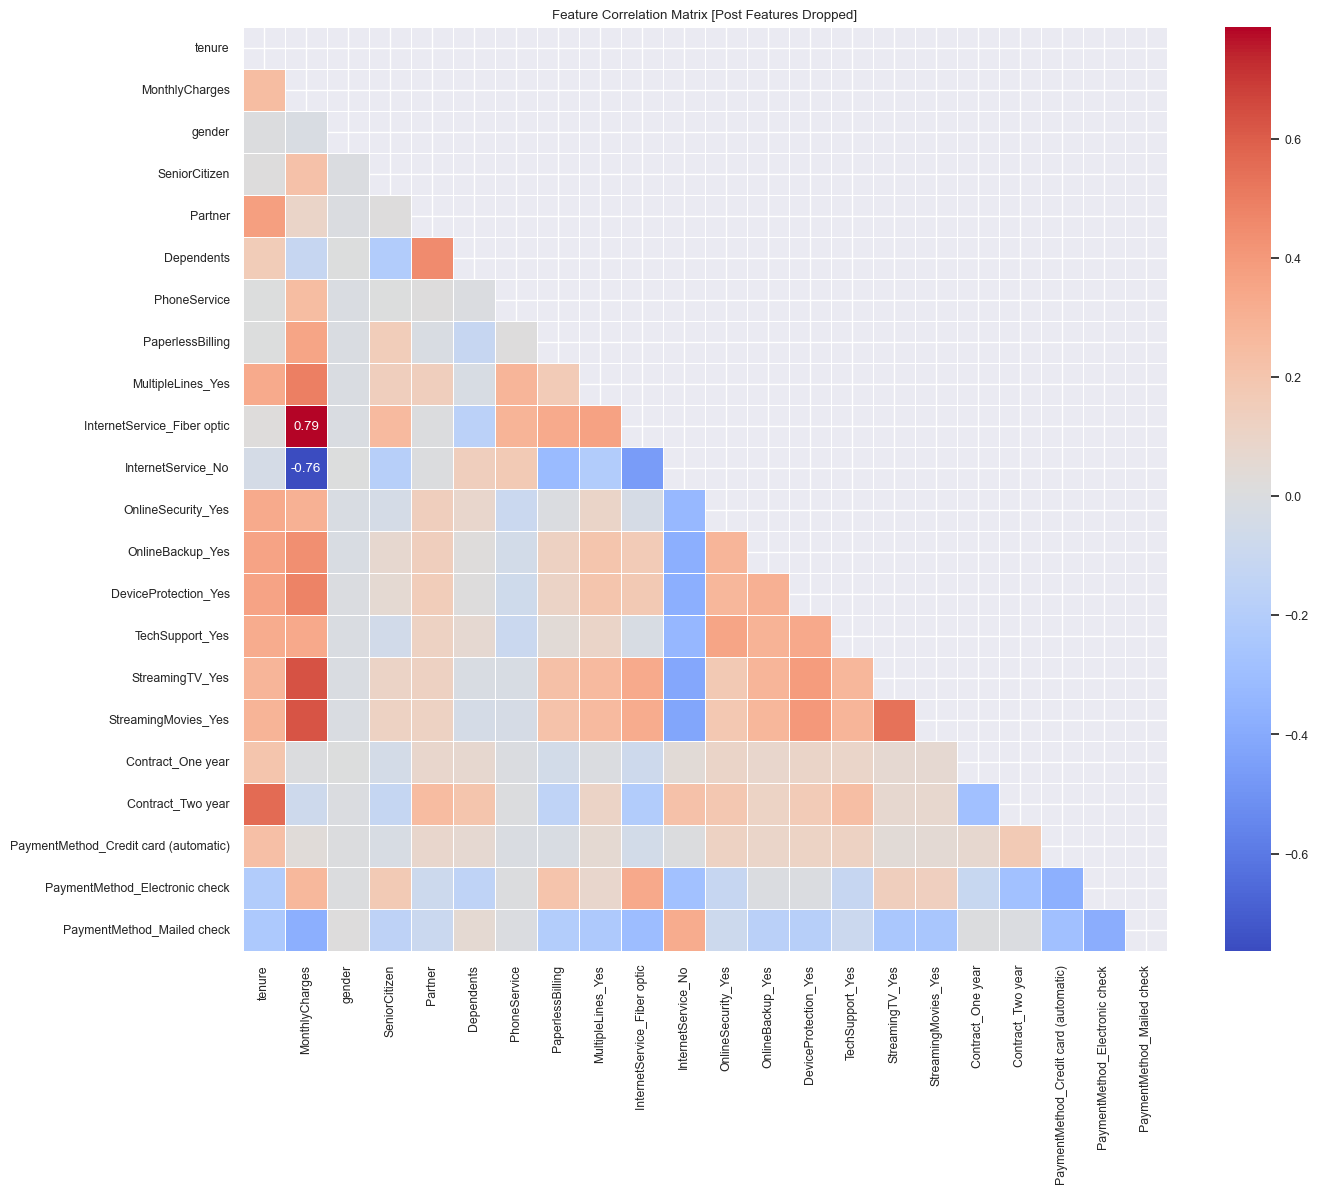
- Some of these features are related to one another (for example No internet service is found multiple times), so it logically makes sense that high multicollinearity would occur. We will remove highly correlated features.
- Some of these features are related to one another (for example No internet service is found multiple times), so it logically makes sense that high multicollinearity would occur. We will remove highly correlated features.
Model Selection and Training
- Two model types were developed…
- A Logistic Regression Model
- Random Forest Classifier
- For the Random Forest Classifier, three different models were used…
- Without additional techniques
- Under-sampling
- This technique was used as there were many more instances of retained customers than churned customers
SMOTE (on Training Data Only)
- To properly implement SMOTE while avoiding data leakage, you should first split your dataset into training and testing sets and then apply SMOTE only to the training set.
- This approach ensures that the synthetic samples created by SMOTE are only used in the training phase and do not influence the testing set, thereby providing a fair evaluation of your model. Here's how you can do it:Key Points:- Split Data First: Splitting the dataset before applying SMOTE prevents the synthetic samples from leaking into the testing set, ensuring that the test data remains untouched and is a true representation of real-world data.- Apply SMOTE to Training Data Only: SMOTE is applied only to the training data (X_train, y_train). This step balances the training data, helping the model learn better from the minority class.- Train and Evaluate on Different Sets: The model is trained on the resampled training set and then evaluated on the original test set. This helps to assess how well the model generalizes to unseen data.
- For the Random Forest Classifier, three different models were used…
Model Evaluation
Different metrics were used to assess the models…
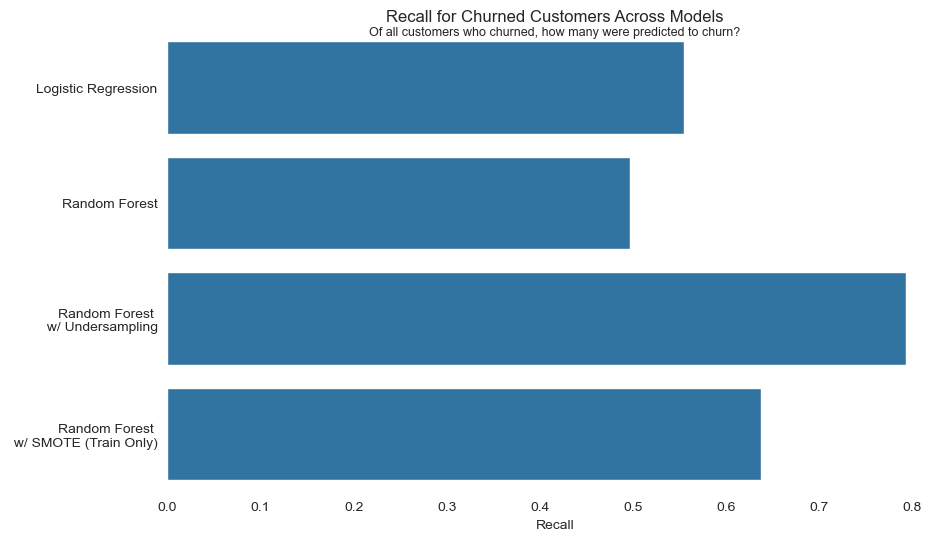
Recall
Recall (also known as sensitivity or true positive rate) measures the proportion of actual positives that were correctly identified by the model. High recall is important in churn analysis if:
The cost of missing a customer who is about to churn (a false negative) is high. For instance, if losing a customer means significant revenue loss and if the company has effective retention strategies that can be deployed if a churn risk is identified.
The goal is to capture as many at-risk customers as possible, perhaps because the business has a high churn rate that needs to be addressed urgently.
Precision
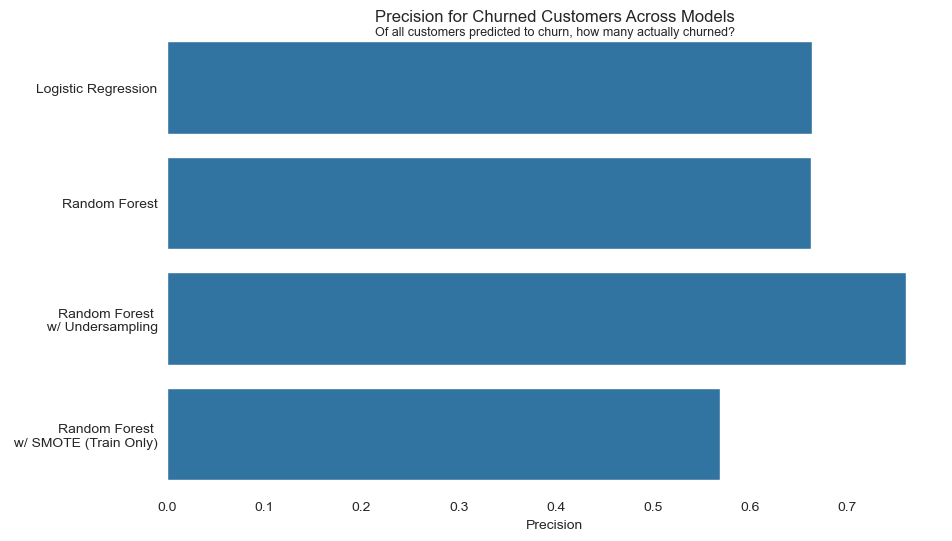
Precision measures the accuracy of the positive predictions made by the model. In other words, it's the ratio of true positive predictions to the total number of positive predictions (both true positives and false positives).
In churn analysis, if a model predicts that certain customers will churn (positive prediction), precision tells you what proportion of these predicted churners did indeed churn.
A high precision indicates that when the model predicts churn, it is usually correct, while a low precision suggests that many customers predicted to churn did not actually churn.
F1-Score
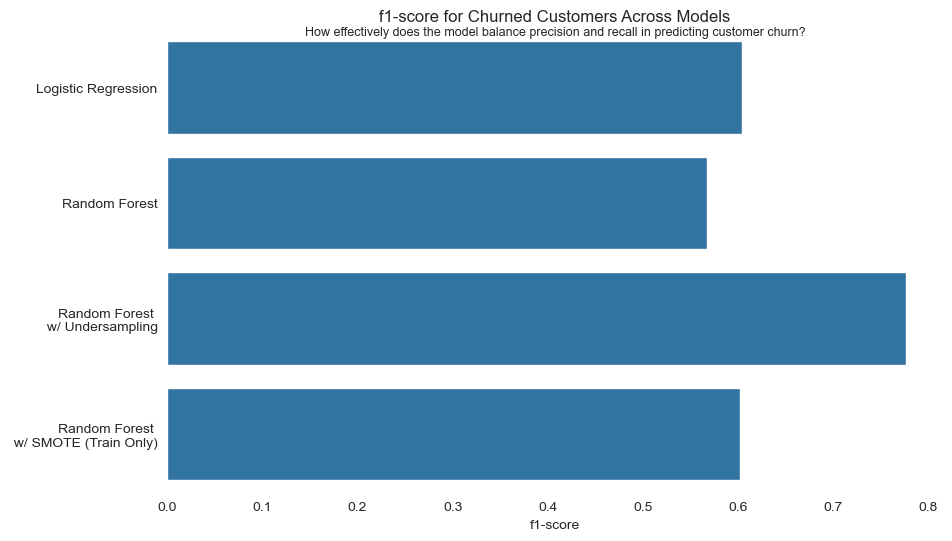
F1-score is the harmonic mean of precision and recall. It is a single metric that combines both precision and recall to give a balanced measure of a model's accuracy in classifying data.
In churn analysis, the F1-score tells you how well the model balances the accuracy of its churn predictions (precision) with its ability to detect as many actual churn cases as possible (recall).
Support
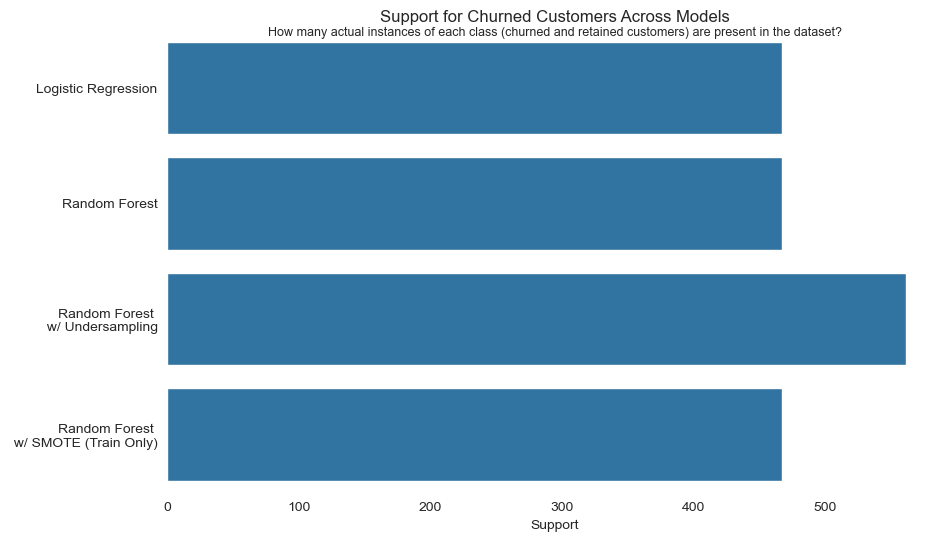
Support refers to the number of actual occurrences of each class in the dataset. In a classification report, it indicates the number of samples for each class (such as 'churned' and 'retained') that were present in the test set.
- In churn analysis:
- The support for the 'churned' class tells you how many customers in your test dataset actually churned.
- The support for the 'retained' class indicates how many customers did not churn.
Insights and Interpretation
Feature Importance
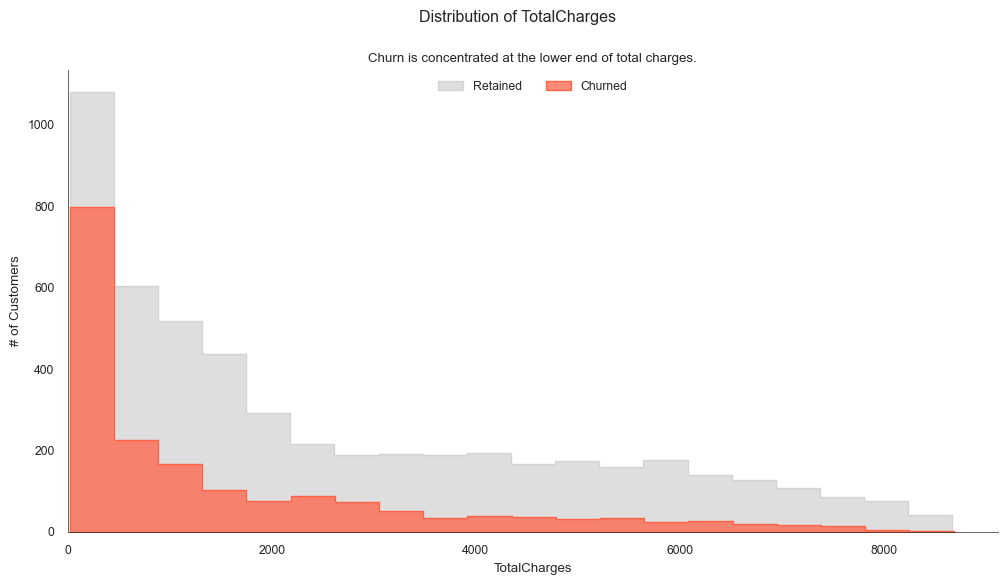
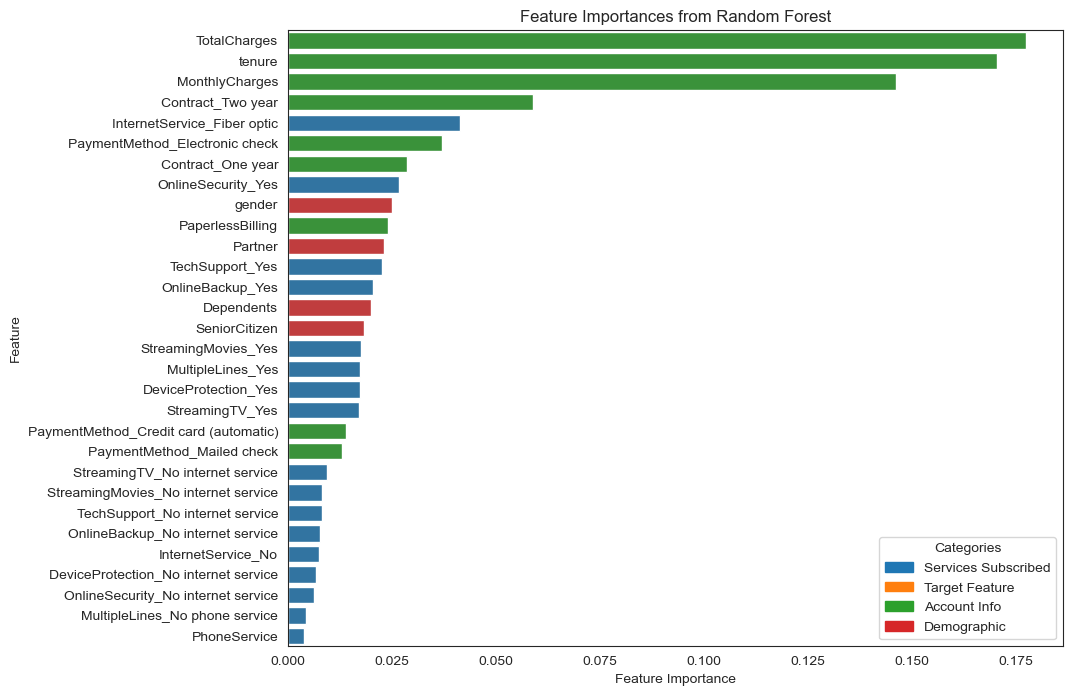
- The most significant features influencing churn appear to be 'TotalCharges', 'tenure', and 'MonthlyCharges', which fall under the 'Account Info' category.
- This suggests that the amount customers spend and the length of their relationship with the company are decisive factors in their decision to stay or leave.
- Features associated with 'Services Subscribed', such as 'OnlineSecurity_Yes' and 'InternetService_Fiber optic', also play a substantial role, indicating that the type and term of services subscribed to are critical in retention strategies.
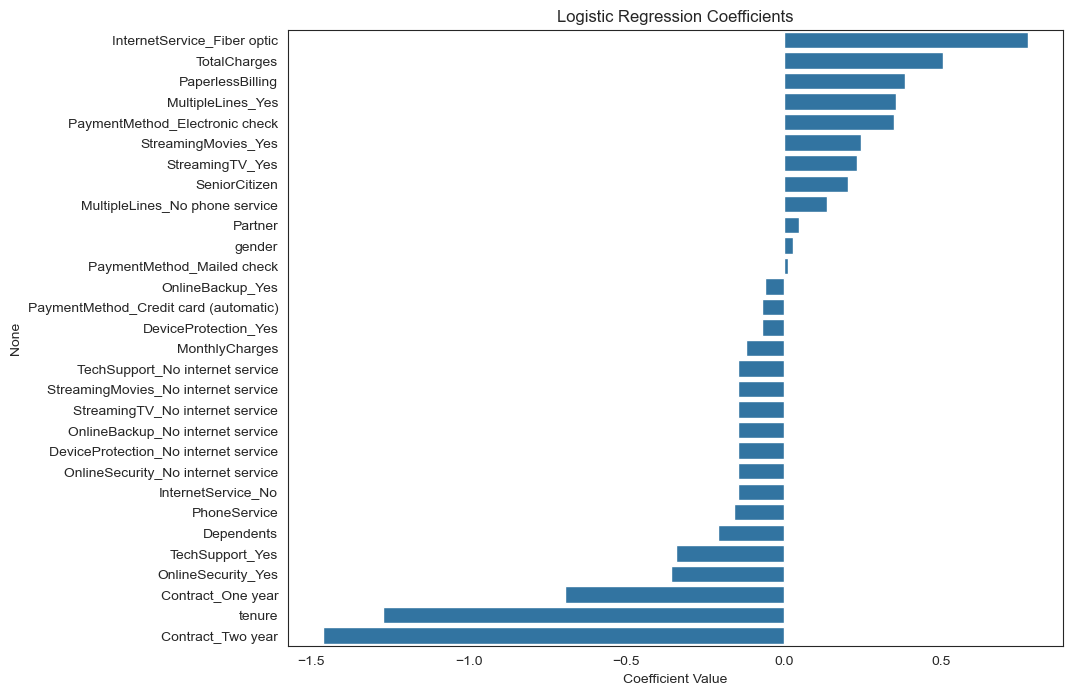
- Across both Random Forest and Logistic Regression models, Fiber Optic Internet service is found to be a significant factor in if customers will churn. This internet service deserves further investigation to see what customers complaints are.
- 'Demographic' features like 'gender' and 'SeniorCitizen' have less influence on churn, implying that personal attributes are less predictive of churn compared to billing and service-related factors.

Conclusion and Recommendations
Summary of Findings
Model Performance Comparison: Through the comprehensive analysis and comparison of various predictive models, this investigation revealed that the Random Forest with Undersampling emerged as the most effective model in predicting customer churn. This model demonstrated a superior balance between precision, recall, and F1-score, indicating its robustness in identifying churn cases while maintaining a high rate of correct predictions. The Random Forest with Undersampling model consistently showed strong performance across these metrics, particularly in terms of recall, which is crucial in minimizing the risk of overlooking potential churners.
Significance of Undersampling: The application of undersampling in preparing the dataset for the Random Forest model was pivotal in achieving these results. This approach effectively addressed the class imbalance issue inherent in our dataset, allowing the model to better learn the characteristics of the churn cases.
Insights into Customer Churn: The project also provided valuable insights into the factors contributing to customer churn.
Future Work
Enhancing Data Collection and Feature Engineering: Future work could explore the collection of additional customer-related data, such as more detailed usage patterns or customer satisfaction scores, to enhance the feature set. Advanced feature engineering techniques, such as interaction terms or more sophisticated encoding of categorical variables, might also yield improvements in model performance.
Exploring Advanced Modeling Techniques: Investigating more complex models or emerging machine learning techniques, such as ensemble methods or deep learning approaches, could potentially improve the predictive accuracy. Additionally, the use of explainability tools and techniques to interpret complex models would be valuable to gain insights into the driving factors behind churn.
Code
- The full Jupyter Notebook is avaiable upon request.