In the years before COVID, Alaska Airlines grew rapidly out of their homebase of Seattle-Tacoma International Airport. This hasn’t been without its challenges. Unfortunately, Carrier Delays have steadily increased and continue to trend upward.
Seattle-Tacoma International Airport, colloquially known as Sea-Tac, is a pivotal hub in the aviation network of the Pacific Northwest and plays a critical role in the global air transport infrastructure. As the primary commercial airport serving Seattle and Tacoma, it is an essential gateway for both passenger and cargo traffic. Its strategic location, coupled with a robust array of domestic and international flights, positions Sea-Tac as a vital nexus connecting various global destinations.
For Alaska Airlines, Seattle-Tacoma International Airport is more than just a significant hub; it is the heart of its operations. As the largest carrier operating out of Sea-Tac, Alaska Airlines has a substantial portion of its fleet and flights concentrated here. The airport serves as the primary base for its extensive network of routes, especially those connecting major cities across the United States, and plays a crucial role in Alaska Airlines' growth strategy and market presence. The efficiency and functionality of Sea-Tac directly impact Alaska Airlines' operational success, customer satisfaction, and competitive standing in the airline industry.
By leveraging data from individual Alaska Airlines flights, the study aims to identify key areas contributing to operational inefficiencies. Given the significant role of Sea-Tac in Alaska Airlines' operations, this analysis is particularly relevant for strategizing improvements in the airline's performance and customer experience.
In this analysis, my aim is to cover a broad spectrum of variables that may influence carrier delays. I’ll delve into fleet composition, scrutinizing specific aircraft and their delay patterns. Additionally, I'll assess temporal factors such as the time of day, day of the week, and seasonality, alongside geographical variables, investigating if certain destinations correlate more strongly with carrier delays. It’s critical to underscore that while identifying correlations is insightful, it does not establish causation. However, pinpointing areas with high correlation offers a strategic starting point for more granular analysis, which may unravel the underlying causes of carrier delays and inform effective solutions.
We'll begin our analysis with a closer look at the Alaska Airlines fleet. It's a logical starting point to examine the aircraft directly since mechanical issues are a leading factor in carrier delays.
There are two aircraft manufacturers Alaska Airlines has purchased aircraft from in the past decade: Boeing and Airbus. Over time, the fleet composition has become more centered on Boeing. As of 2024, Alaska Airlines fleet has shifted to entirely Boeing 737's (source).
The fleet composition has increasingly favored Boeing aircraft over time. This raises the question: was shifting focus towards Boeing the right move? When analyzing carrier delays specifically, the following plot, which looks at Carrier Delays across all years studied, suggests it was a prudent decision. Airbus aircraft, on average, experience higher rates of carrier delays, and the incidence of delays escalates more sharply as these planes age. While these findings are statistically significant, it's important to consider that other factors could be at play, such as total miles flown, average flight length, frequency of service, passenger capacity, and more, which might also influence the observed trends.
When we examine how the timing of a flight correlates with delays, taking into account various years and destination airports, we observe significant variability.
In 2022, There are higher percentages of delays during the evening hours, particularly from 6 PM to Midnight. It seems while some improvements have been made in this range in 2023, the 9 PM to 10 PM window on most days, particularly Friday and Sunday, still shows high delay percentages.
At the hourly level, definitive conclusions are hindered by the limited sample size and the nature of our comparisons. Consequently, I have grouped times of day into broader intervals to provide a more robust basis for making substantial recommendations.
Upon this adjustment, a distinct pattern emerges, indicating that from 6 PM onwards, carrier delay rates climb, with flights after 9 PM being particularly affected. This trend is consistent across all days of the week.
Based on these insights, I recommend the following actions for the time slots starting from 6 PM, which demonstrate significant delay rates:
The substantial rise in delays at airports already experiencing high rates of carrier delays, especially the significant uptick at Detroit Metropolitan Airport, necessitates an in-depth investigation into the contributing factors behind this trend.
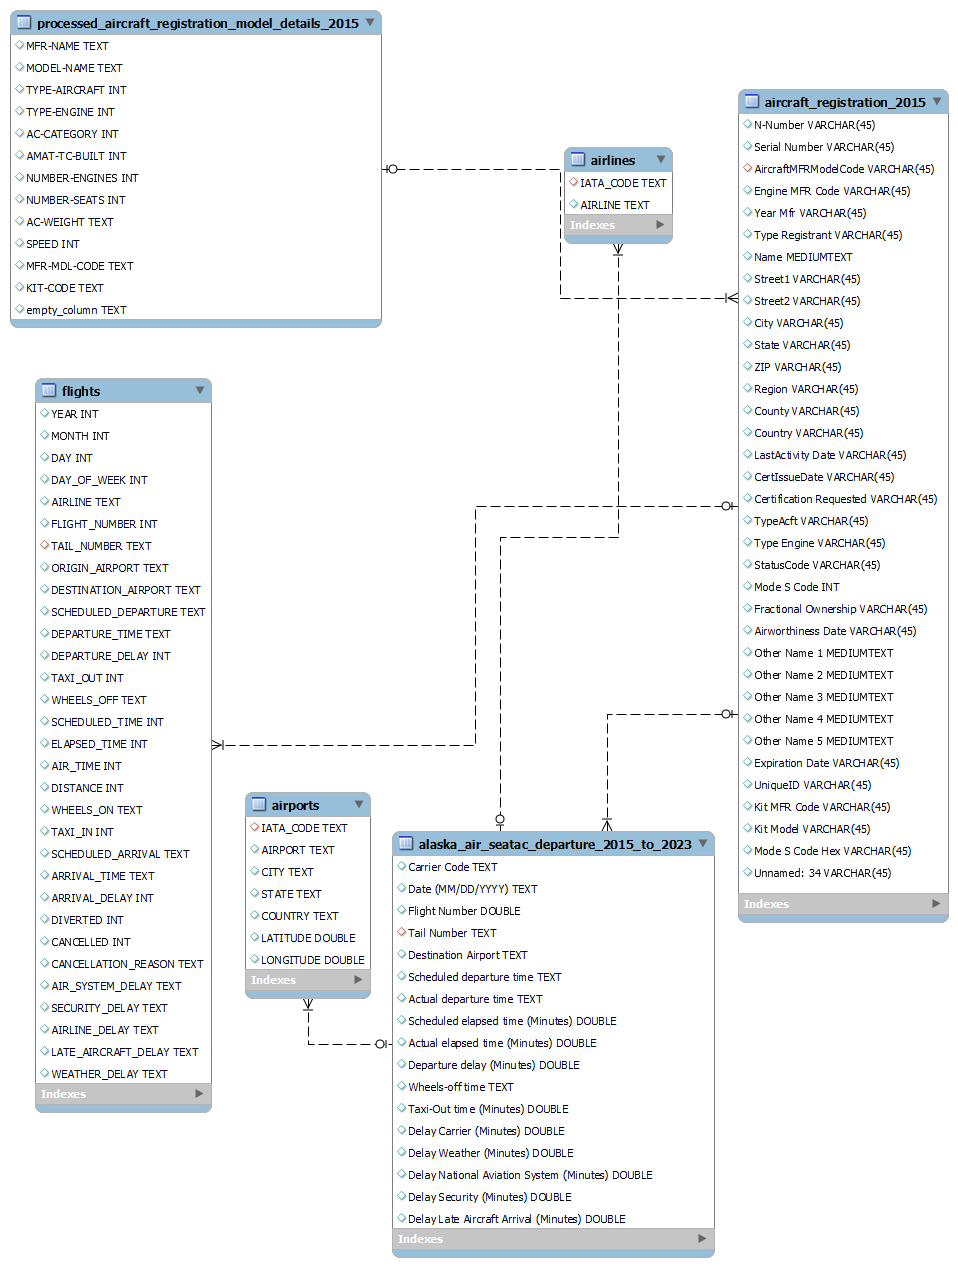
The analysis of airline delays at Seattle-Tacoma International Airport leverages three primary data sources, each offering unique insights into different aspects of air travel and aircraft operations.
This dataset offers from the Department of Transportation's extensive statistics on flight departures. It encompasses a wide array of fields critical for analyzing delays, including:
Available directly from the FAA's official website, this comprehensive database includes several key files that detail aircraft registration and specifications:
The GADB is a freely available database encompassing over 9,300 airports worldwide, from major international hubs to smaller regional airports. It provides comprehensive details such as:
This SQL query is instrumental in correlating flight details from Alaska Airlines' departures at Sea-Tac from 2015 to 2023 with specific aircraft registration data, ensuring the aircraft's registration was valid at the time of the flight and that the flight occurred after the aircraft's certification. By linking to processed aircraft model details, we can gain insights into the aircraft models in use, facilitating a deeper analysis of potential factors influencing carrier delays.
        SELECT
        aa.*,
        ar.`Name`,
        ar.`Year mfr`,
        ar.`CertIssueDate`,
        ar.`LastActivityDate`,
        ar.`Expiration Date`,
        pa.*
    FROM (
        SELECT *,
            SUBSTRING(`Tail Number`, 2) AS `Tail_Number_Extract` -- 'Tail Number' starts with an N, so this gets rid of that
        FROM alaska_air_seatac_departure_2015_to_2023
    ) AS aa
    LEFT JOIN aircraft_registration_2015 ar
    ON aa.`Tail_Number_Extract` = ar.`N_Number`
    AND DATE(ar.`Expiration Date`) > STR_TO_DATE(aa.`Date` (MM/DD/YYYY), '%m/%d/%Y') -- Aircraft Registration Does Not Expire before the flight date
    AND STR_TO_DATE(aa.`Date` (MM/DD/YYYY), '%m/%d/%Y') > DATE(ar.`CertIssueDate`) -- Flight Date is after the Aircraft has been Certified
    JOIN `processed_aircraft_registration_model_details_2015` pa
    ON ar.AircraftMFRModelCode = pa.`MFR_MDL_CODE`

After integrating the initial data via the above SQL query, I proceeded with further cleaning, such as converting specific columns to appropriate data types for better analysis. I then conducted inner joins on airline and airport tables to merge the data effectively. Next, I created a .hyper file, a Tableau-specific high-performance data file designed for optimal data query and storage efficiency. This file forms the basis of my Tableau dashboards and visualizations, enabling in-depth and interactive data exploration.
Finally Data was imported into Tableau to create visuals. Many calculated fields were used at this phase. For example, I created a calculated field to convert the 'Scheduled Departure Time' to a time of day (morning, afternoon, evening, or night) to better understand how the time of day impacts carrier delays, as well as creating a calculated field to convert the 'Date' to a 'Day of the Week' to understand how the day of the week impacts carrier delays.